


Make sustainability reporting and energy efficiency a win-win for you and
your portfolio.
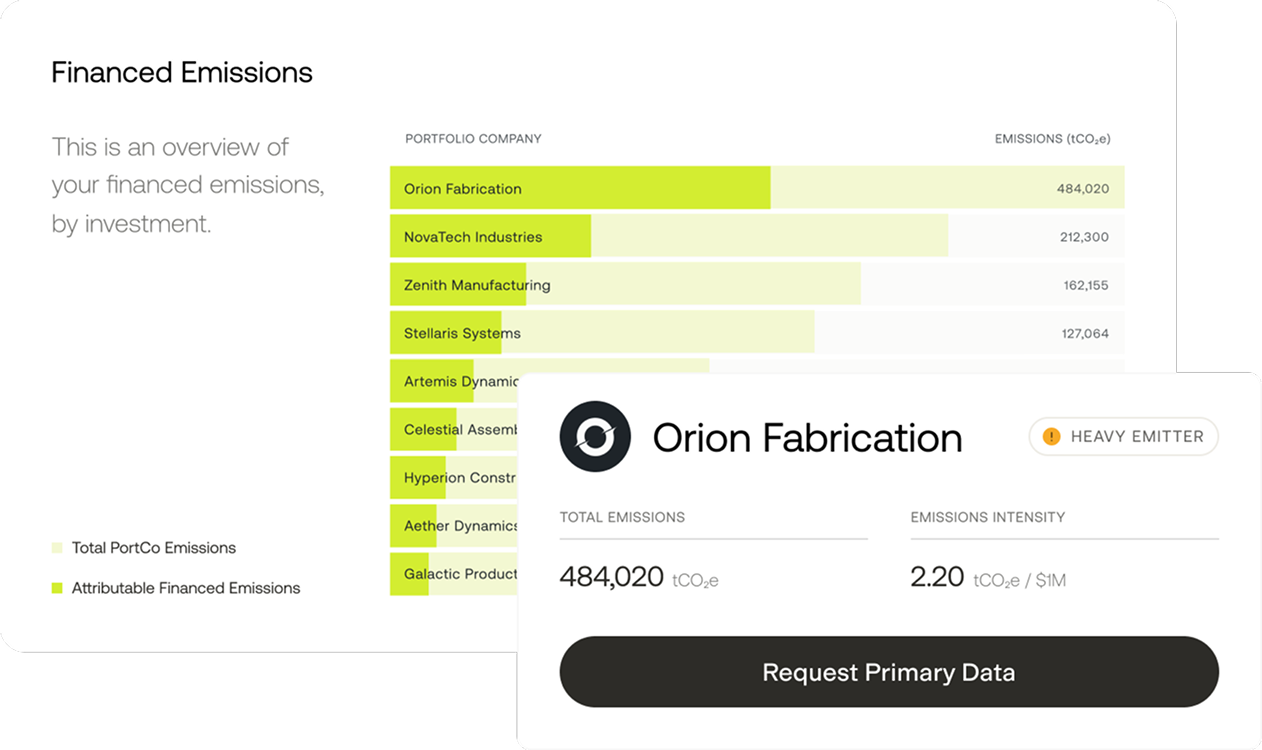
Get a complete picture of your financed emissions
Capture your portfolio in full
Automate bottom-up and top-down measurements of your carbon, energy, and sustainability data.
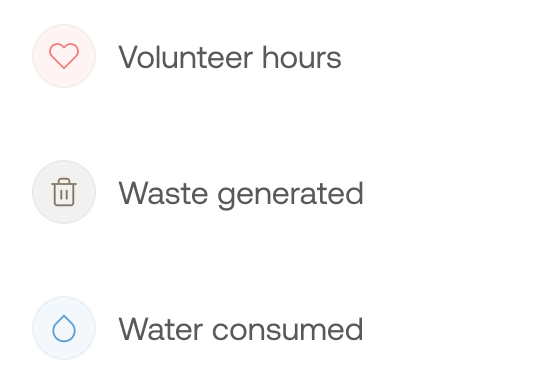
Manage all of your metrics
Manage all your ESG metrics in one place.
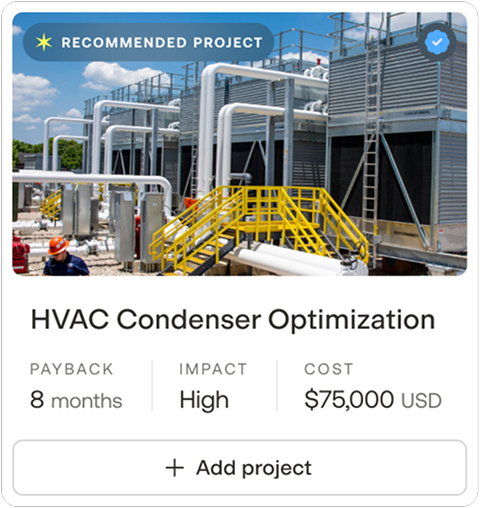
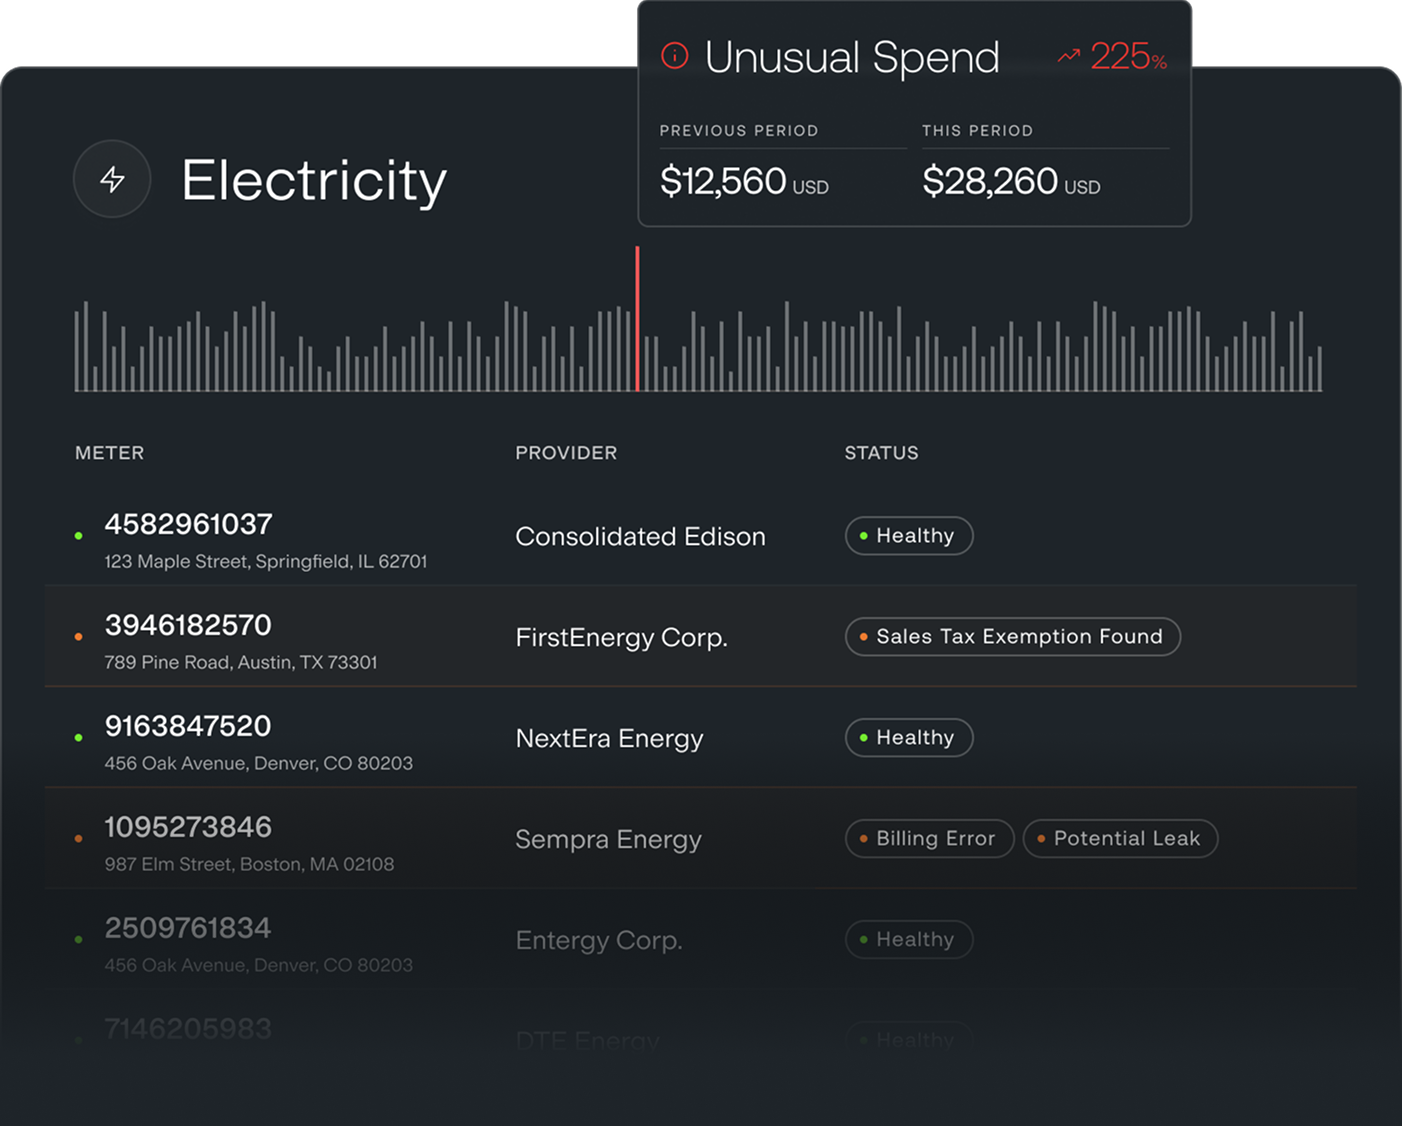
Empower portcos
Enable portfolio companies to report painlessly and take action to reduce energy use and emissions.


%20(1).png)
