
See why customers are switching to Gravity
Developing An Emissions Accounting Methodology for AI
Amidst rising AI adoption, companies looking to fully capture their carbon emissions footprint must determine how to accurately measure the impact of their AI usage. See how Gravity worked with Grove Collaborative to develop an initial emissions accounting methodology based on the latest science and research.
Introduction
AI is a requirement for companies to remain competitive today. However, amidst rising AI adoption, many companies looking to fully capture their carbon emissions footprint face a new accounting challenge: how to measure and report the impact of their AI usage. How does one measure a ChatGPT query? Or assess the impact of building an app on Loveable? To capture a full picture of a company’s emissions, they will also need to report on the emissions related to their AI adoption.
Gravity recently partnered with Grove Collaborative, a leading online sustainable consumer products company and the world’s first plastic neutral retailer, to proactively capture the environmental impact of their AI use. Due to the lack of first-party emissions data from direct model AI services, like Open AI, or third party solutions leveraging LLMs in their products, Gravity developed an emissions accounting methodology for companies to get an understanding of their AI-related emissions.
AI is changing fast, as are best calculation methodologies. Recognizing that this is an evolving space, this methodology is only a starting point based on the available science, research, and data – and one that will be refined and updated as more data becomes available. Today we are sharing this AI emissions formula —covering energy intensity, data usage, hardware efficiency, and more—to serve as a resource for other organizations looking to better understand the environmental impact of their AI use.
Any companies facing similar challenges in understanding their AI-related emissions can use this approach to get started. The Gravity team is also available to help you capture a complete and accurate picture of your use.
AI Calculation Methodology
There are several key inputs that are needed to leverage the calculation:
- Energy used by each AI model (e.g., GPT-4, Claude 3.7 Sonnet);
- The number of accounts that leverage each model;
- The usage of each of the accounts that leverage each model (defined as the number of queries per account).
Estimating Energy from AI Inference
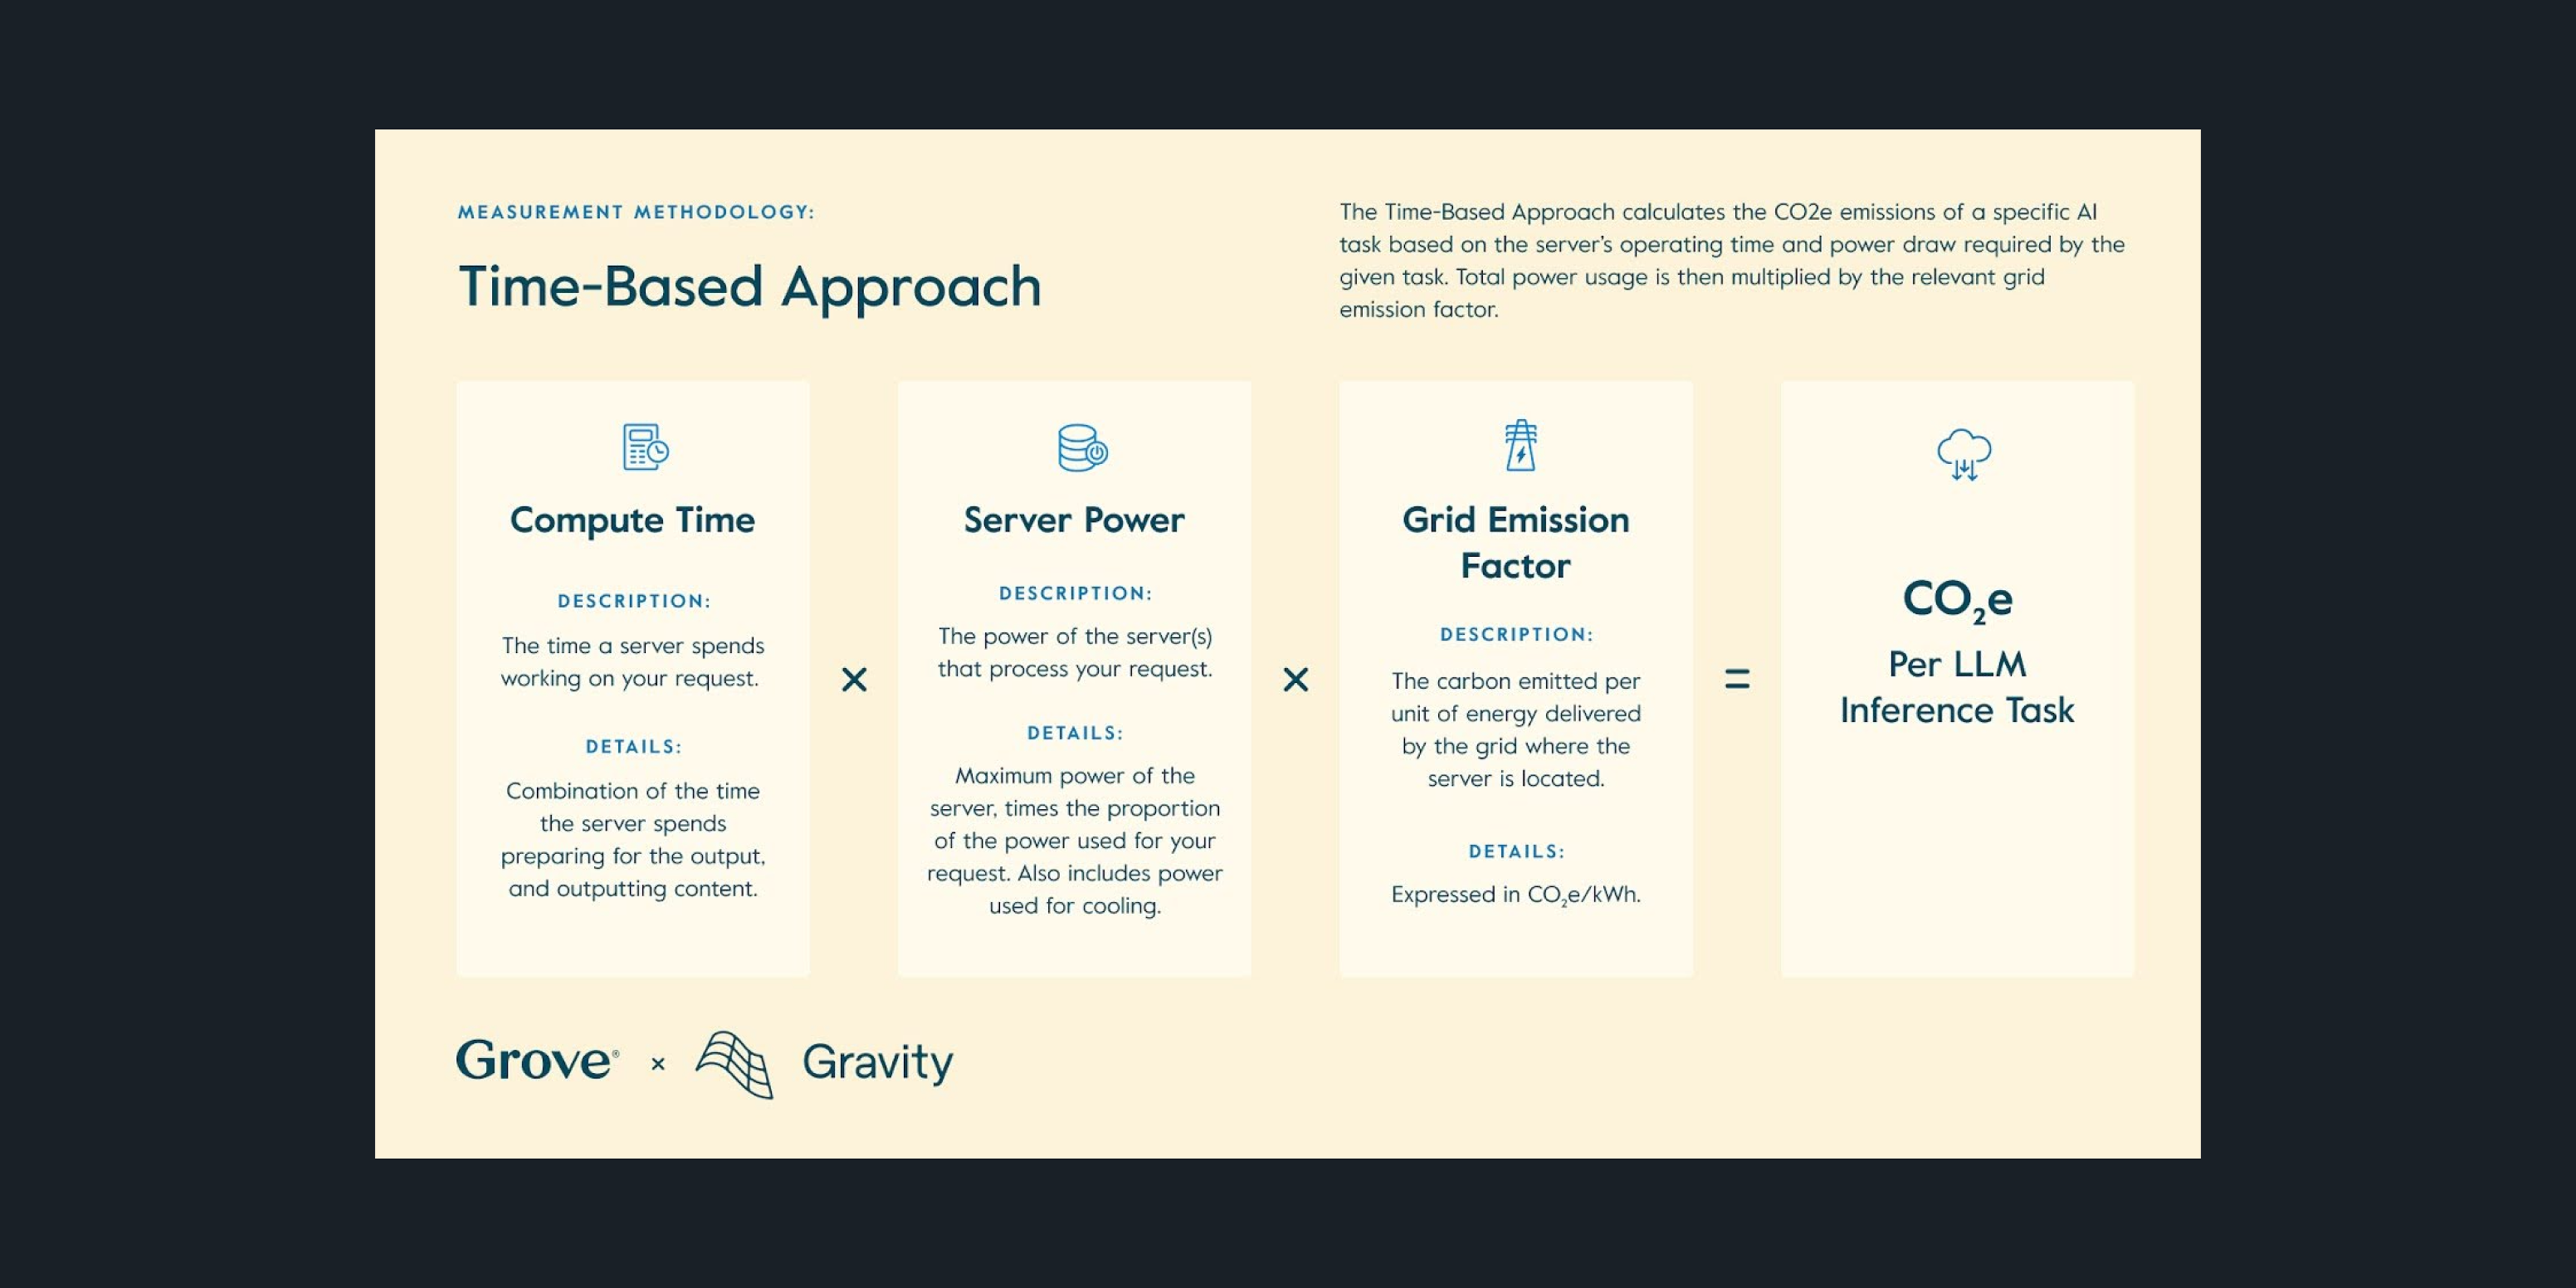
In order to calculate Grove’s emissions from large language model (LLM) inference, Gravity developed a time-based methodology, building on work by Nidhal Jegham et al. The methodology provides energy consumption from AI inference on a per-query or per-task basis through the formula pictured in Figure One (above).
This methodology is “time-based” in the sense that it does not rely on a proxy value for server power response time (such as model parameter count). Instead, the primary inputs are the time a server spent preparing a response to an LLM query, the maximum possible power (in watts) of the system processing the response, the estimated utilization of the server, and the assumed efficiency of the datacenter where the processing occurred.
The methodology includes two utilization rates for GPU and non-GPU hardware components, as well as 25 different combinations of latency and response times due to variations in latency and response speeds. As such, the initial output of the calculation results in 50 possible watt-hour measurements for any given query. Gravity calculated a weighted average based on the statistical likelihood of any given combination of response speed and latency occurring for both the low and high hardware utilization figures separately, and then averaged the results.
Additionally, because data centers are not 100% efficient due to power consumption by cooling infrastructure and other supporting services, the energy used by the servers is multiplied by the average power usage effectiveness, or PUE, of the data center infrastructure, employing reasonable assumptions about host providers of the inference task.
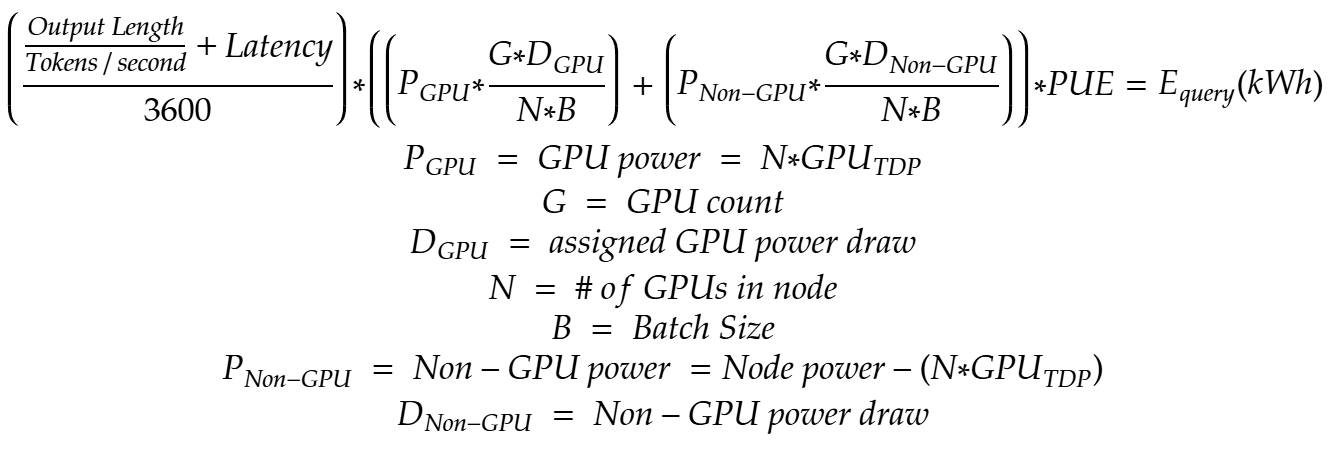
Figure One: Output length in tokens is divided by the output speed of the model to yield output time in seconds. This is added to latency and divided by 3600 to yield response time in hours. This figure is multiplied by the wattage of the likely hardware components that were deployed to respond to the request after utilization adjustments. Lastly, the total energy in kWh is multiplied by a data center’s efficiency (PUE) expressed as a ratio of the total power consumed over the power consumed by server hardware.
The methodology is capable of providing energy estimates for three different response lengths for each mode. Therefore, Gravity conducted the calculation three times for each model. The resulting output is a matrix of possible watt-hour figures for each model depending on the number of output tokens.
To then convert energy to emissions, typically a regional grid emission factor (expressed as units of CO2e per unit of energy consumed) would be applied to the energy used, as the carbon intensity of electricity generated varies by location. Due to limitations in publicly available hyperscaler infrastructure information, it isn’t currently possible to know where geographically a specific query was processed. Therefore, Gravity multiplied the energy consumed by a given query by the average grid factor for the United States.
Understanding Grove’s Use of AI
Next, Gravity took into account Grove’s specific business context and AI usage practices to get to the closest possible emissions estimation. The Gravity team worked with Grove to determine the total number of approved corporate accounts with access to AI tools across Grove’s entire software tool portfolio. The number of accounts for any given tool was then divided by the number of models offered by any given tool in order to distribute usage across all models provided by a tool.
In the absence of information regarding which models are leveraged by a given tool, which is not available today from every software tool provider, the Gravity team assumed the accounts for a tool used all available models equally. Note that Gravity was not able to determine which models a tool used more often than others. For instance, if Grove had 100 accounts with access to ChatGPT, the calculation assumes the 100 equally used AI models provided by OpenAI based on Grove’s license level. The result of this calculation is a proxy metric of Grove accounts per model in addition to a boolean matrix with models on the Y axis and tools on the X axis, and a true or false value if a tool uses a model.
Many AI tools provide access to similar AI models. For instance, both ChatGPT and Cursor leverage models published by OpenAI. Additionally, the methodology described above produces watt-hour estimates for each model, not each tool. To account for this, Gravity summed the number of proxy accounts that use a given model across all tools. The result is a list of models, and the number of proxy accounts that use that model.
Applying Energy Estimations
The next step of the calculation was to multiply the count of proxy accounts that used a given model by the actual usage of each account. Grove provided Gravity with Grove’s usage data of OpenAI tools on a per account basis, which Gravity applied to both Grove’s OpenAI usage as well as usage of all other tools in the absence of a tool-specific usage metric.
The OpenAI data does not at present include the average length of each response, either as a time-based metric or as a count of words / tokens returned. To account for this discrepancy, Gravity multiplied the total queries per day per model by three custom factors for different response lengths (225 words, 750 words, and 1125 words) in such a way that the sum of the three factors would equal one. The result of this calculation is another matrix containing queries per model per response length per day.
Finally, Gravity multiplied the count of queries per response length per model per day by the estimated energy consumption of the appropriate model for the given response length.
Impact & Next Steps
Using this methodology based on the best available data from large language model providers today, Grove and Gravity prepared a conservative estimate that Grove’s projected 2025 AI-related carbon footprint is 17.8 metric tons of CO2e. This estimate accounts for Grove's current AI tool usage and reflects higher AI tool usage levels based on Grove's anticipated increased usage of AI tools moving forward.
These numbers represent a first step towards measuring AI-related emissions, and, as noted above, the approach includes reasonable assumptions where necessary. As the AI ecosystem matures, it is hoped that model providers and other actors will increase the transparency of their disclosures, including in ways that allow for estimation and allocation of emissions from model training and data center construction, which were out of scope of this analysis. Gravity will continue following, and encouraging, these developments, and developing more accurate emissions calculation approaches accordingly.
See why Amazon suppliers choose Gravity
Request a demo to see how Gravity makes reporting easy and cost-effective
Download the report to learn more
VerdantixTM Smart Innovators: Carbon Management Software
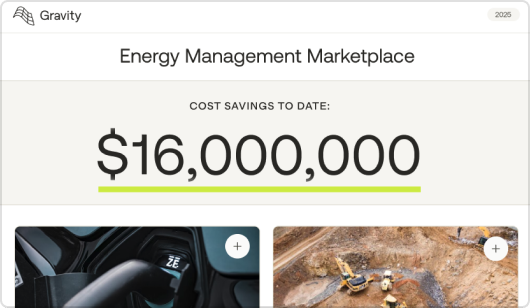
Curious about Gravity's Energy Management Marketplace?
Book a demo to learn more
Curious about Gravity's Europe expansion?
Book a demo to learn more
.png)
Ready to get off the merry-go-round?
Book a demo to learn more.

Curious about Gravity's CDP accreditation?
Book a demo to learn more.

California's Carbon Reporting Rule
Watch our webinar to prepare for California's new climate regulation

Curious about these features?
Book a demo to learn more.

Be prepared for SECR
Meet with our team, walk through the steps you'll need to take to report, and start a free trial to see how Gravity can help you report with greater speed and accuracy.

See the platform in action
Watch a short video to see why leaders like WM, TTI, and WAF have chosen to work with Gravity to simplify carbon accounting and drive business impact.

Meet with our team, walk through the steps you'll need to take to report, and start a free trial to see how Gravity can help you report with greater speed and accuracy.

Cut down reporting time by 70%
Request a demo to see these features in action and learn how they can save hours of manpower in your next reporting cycle.
Looking to Uplevel Your Sustainability Programs in 2025?
Reach out for a personalized meeting with our climate experts to find opportunities to save time on regulatory compliance, simplify internal communications, and execute projects that deliver real business impact.
Find energy efficiency projects that deliver value
Learn how to reduce energy costs and emissions.
Be prepared for the CSRD
Get in touch to find out how your company should prepare for the CSRD amidst changes to the regulation.


%20(1).png)